I am announcing the slickest and easiest performance monitoring tool for cloud computing ever! There are many tools out there to achieve this goal, but my favorite is My-Netdata.
My-Netdata is a simple, effective, and excellent performance monitoring tool that is easy to install, mostly self-configures, is cloud-based, runs on Ubuntu, and has super sexy dashboards.
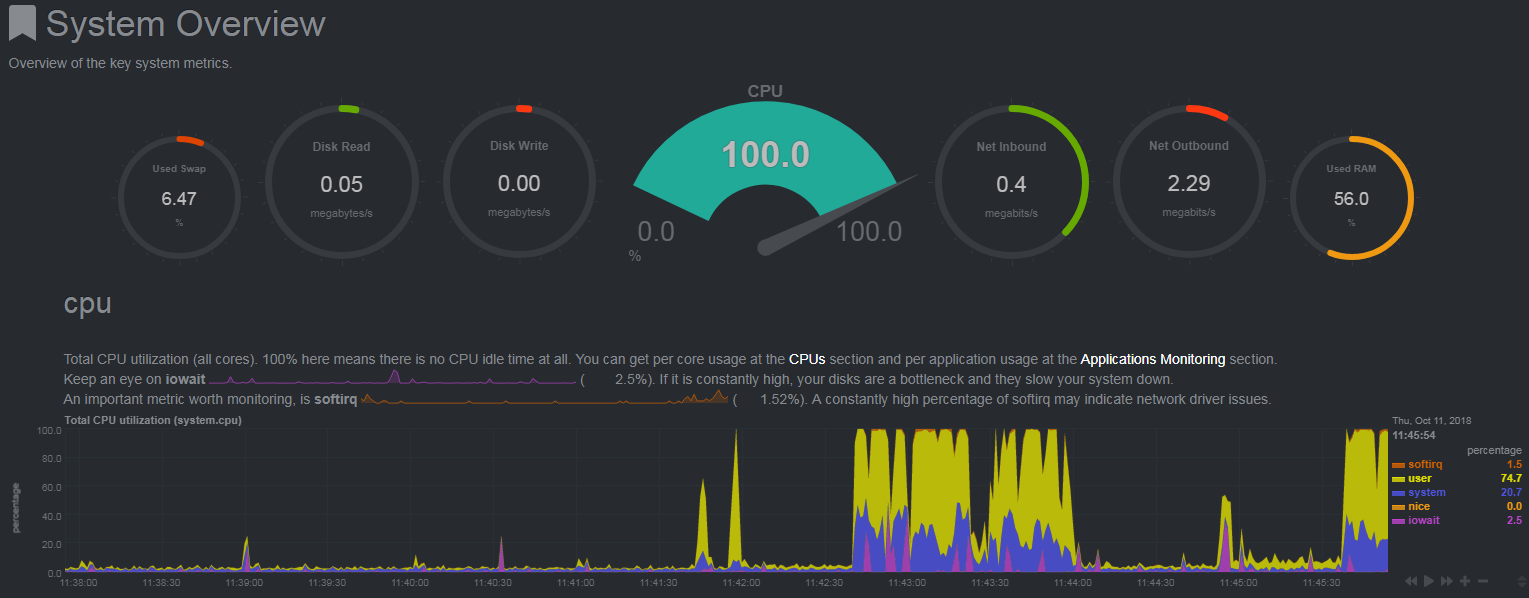
Just look how cool it looks below!!! Or click here to try their demo.
How do you install My-Netdata?
It is easy to install My-Netdata using the automatic one-line install. The one-line method uses the source, which is kept up to date.
Run the following command in your shell:
bash <(curl -Ss https://my-netdata.io/kickstart.sh)
Note: Do not use ‘sudo’ as the install will use it when needed.
Click here for more information about the install.
Why did I choose My-Netdata?
It took me some time to discover it, and frankly, it seemed too good to be true! My-Netdata does what it says on the box. My-Netdata provides “unparalleled insights, in real-time, of everything happening on your systems and applications, with stunning, interactive web dashboards and powerful performance and health alarms.”
My-Detdata provides super sexy dashboards that are web-based, with no configuration needed for the dashboards, are easy to use. Visit this infographic to see what My-Netdata can monitor.
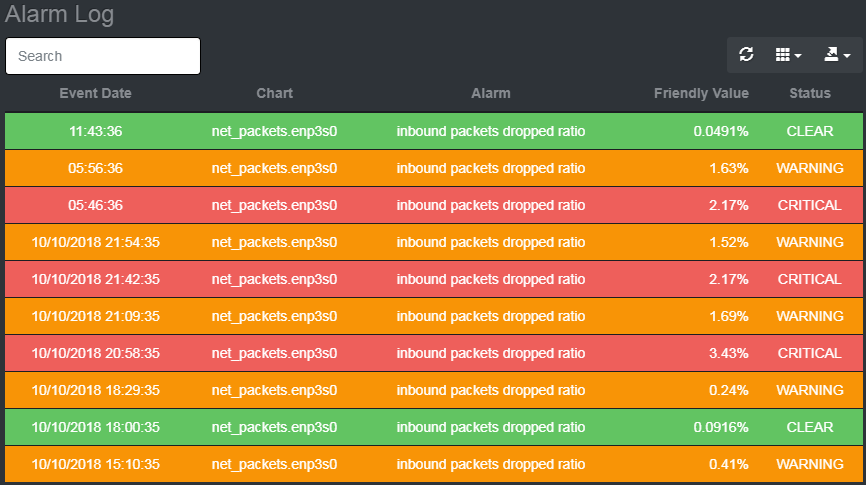
You can run My-Netdata on your cloud servers at AWS or on your local Ubuntu server at the office. All of it is easily accessible via the browser, and you do not need to be an expert to find a graph that seems out of the ordinary. My-Netdata also provides an alarms section that highlights the most critical items if you are not interested in diving through charts.
Please take a look at some of these impressive dashboards from one of my servers.
You could also visit https://my-netdata.io/ for more info and even interact with some live performance dashboards to try it.
Why do I need a performance monitoring tool?
I am running a couple of servers. Some of them are cloud-based, and some are on-premise. These servers run NodeJS and PHP applications, PM2 (an advanced production process management service for NodeJS), MySQL, MongoDB, and Apache. There are some CPU-intensive services, which could require some manual intervention. It’s quite literally a circus out there, and I need to keep a watchful eye.
What do I need to monitor?
You could monitor everything, but the amount of data would be overwhelming! Furthermore, looking at numbers alone can be meaningless without context. Sometimes you are looking for something that you did not know you need to monitor. In my case, I needed something that can provide metrics on all the data points, but in a way that allows me to browse and easily find problem areas. However, the performance monitoring must serve as a minimum display metric for CPU, Memory, NFS, Apache Workers, and Bandwidth. Most tools can provide this info, but not all can display the information in an easy-to-digest manner. My-Netdata provides plugins that need minimal configuration for new applications to monitor.
Let me know what you think! Do you have a performance monitoring tool that you can recommend?


Great post! Nice.