Performance monitoring is an essential skill for any Linux user. All Linux platforms provide a tool called ‘top’ for this task. I prefer using ‘
This article shows an easy way to add htop to your RHEL instance. There are other ways, which include downloading htop and then compiling it on your RHEL instance. This post only discusses adding the repository so that you can download and install htop – the easy way!
Install htop on RHEL
You can read the rest of the post for more detail, but to install htop, you need to add the EPEL repository to your RHEL instance.
Enter the following in your shell to add the repository:
sudo rpm -ivh http://download.fedoraproject.org/pub/epel/7/$(arch)/e/epel-release-7-5.noarch.rpm<br>Next, you need to install EPEL by entering the following:
sudo yum install epel-releaseLastly, to install HTOP, enter:
sudo yum install htopFinally, launching htop should be as simple as entering:
htopNote that Ubuntu 18.04 should have htop installed by default.
What is EPEL?
EPEL (or Extra Packages for Enterprise Linux) is a community-supported repository hosted by the Fedora Community project. Thus, for help with HTOP, contact the developer. The Fedora Community creates, maintains, and manages the EPEL repository, which provides an additional set of quality software packages to Red Hat Enterprise Linux (RHEL), CentOS and Scientific Linux (SL), Oracle Linux (OL).

What is HTOP?
htop is a system monitoring utility that runs on the shell. It provides many great features for monitoring memory and CPU utilization, threads, and much more. You can monitor your system, view processes, and even manage processes. htop also provides a text-graphical interface! Overall, it is an excellent tool for anyone who knows what’s happening on a Linux instance.

What can you expect when using htop?
htop provides the following useful features:
- Graphical-text interface – Displays horizontal bar charts that dynamically adjusts based on shell window size.
- Coloured text – Especially useful when looking for high vs medium memory and CPU utilisation.
- Highly configurable – Allowing you to set up the tool, search, filter and sort data. You can even view process trees by just pressing F5.
- Process management – Press one button to kill a misbehaving process!
htop Screenshots
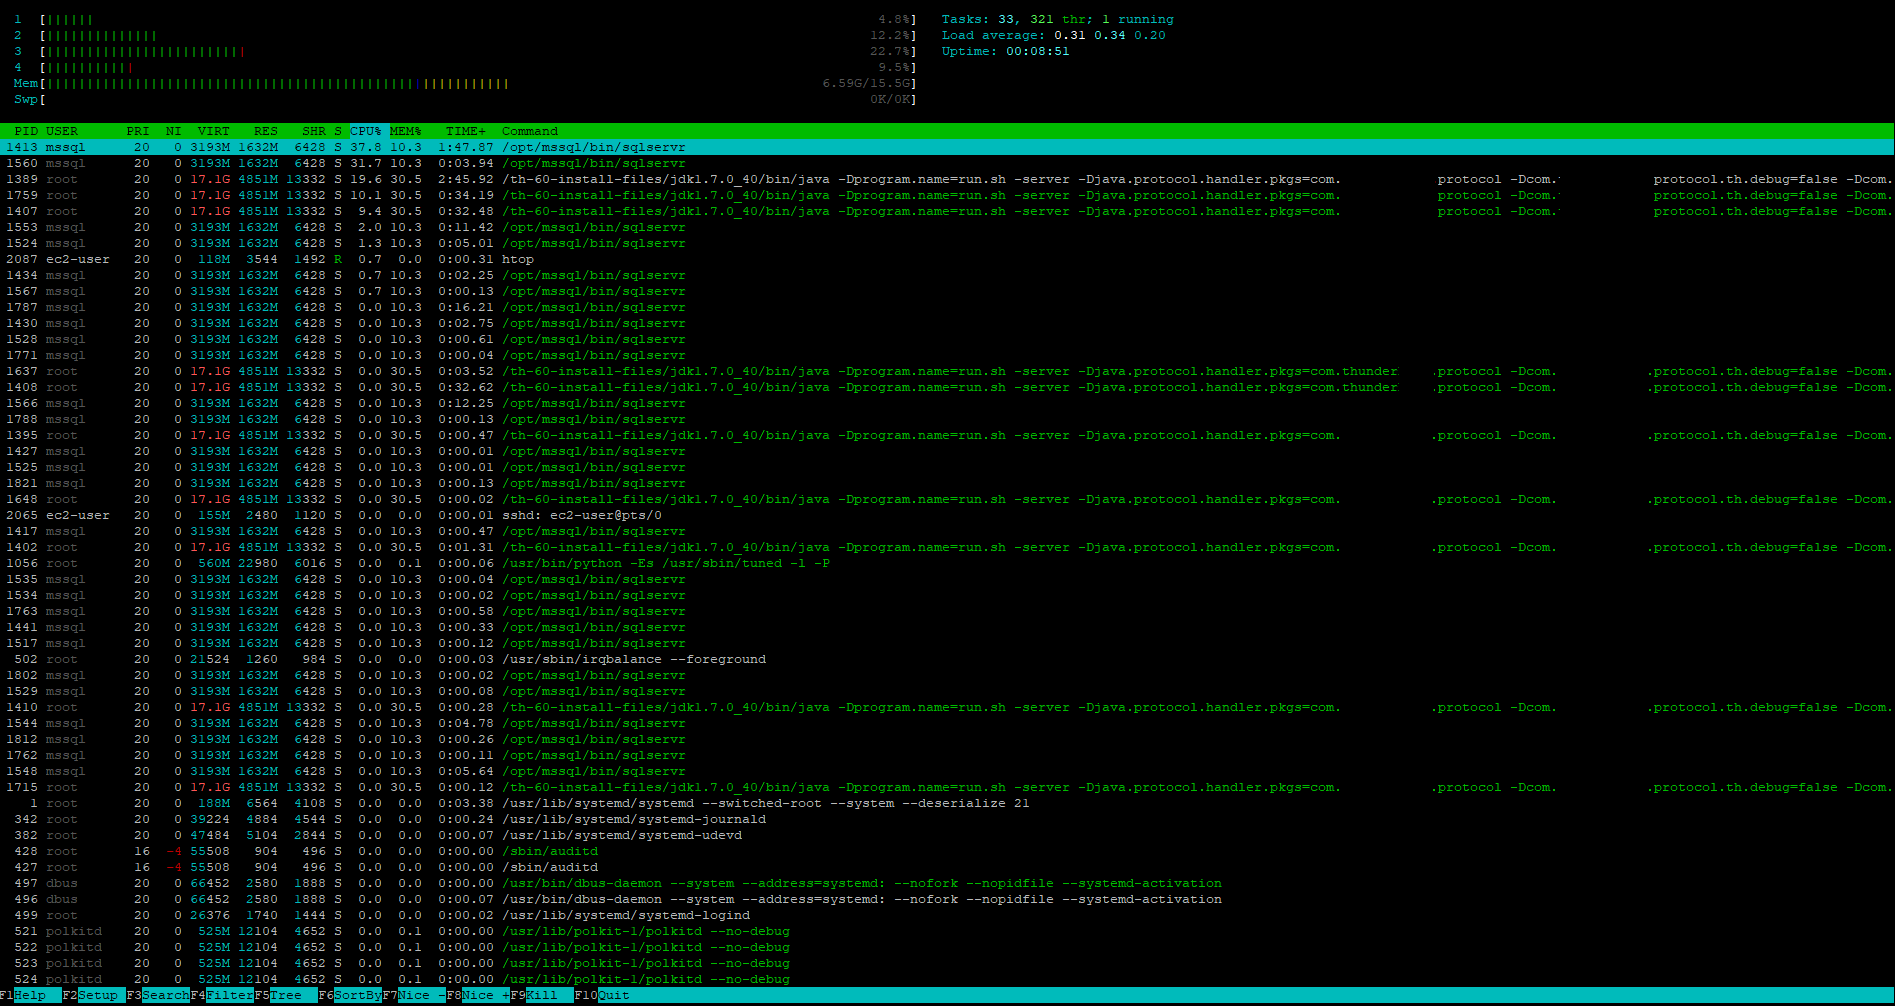
The following view is the default start-up view, which highlights the graphical-text interface:
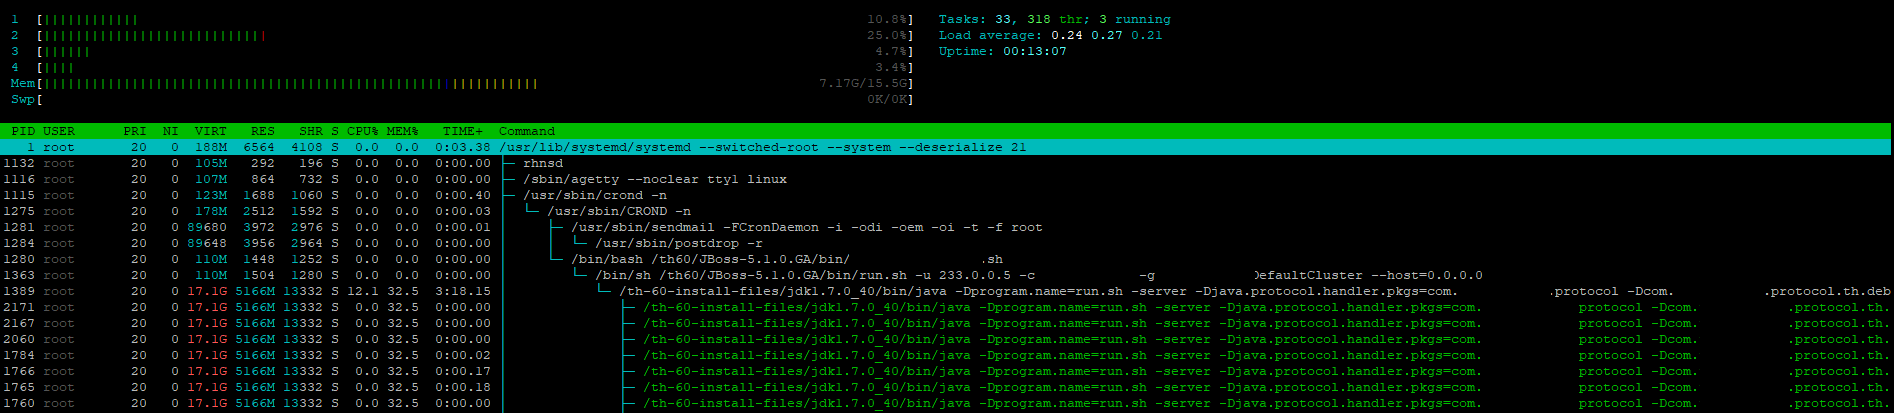
The process view in htop is excellent and sometimes provide much-needed clarity:
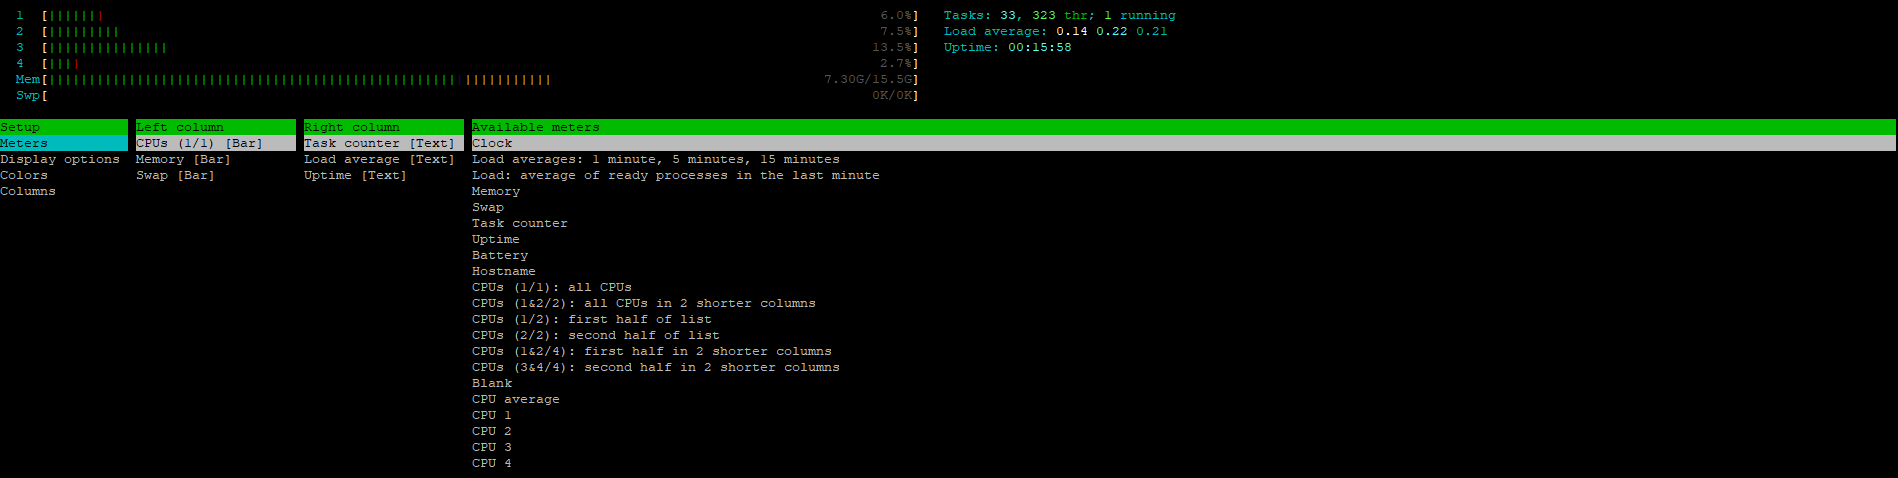
This view shows some of the htop setup features that are available:
htop vs top
The
htop is usually not pre-installed but is as of Ubuntu 18.04 (Bionic). You rock, Ubuntu!